PIE
Draws a pie based on an ellipse's outline in a segment between two semi-straight lines.
Syntax
PIE [ x:measureValue ] [ y:measureValue ] [ rx:measureValue ] [ ry:measureValue ]
    [ x1:measureValue ] [ y1:measureValue ] [ x2:measureValue ] [ y2:measureValue ] .
Parameters
x(measureValue, optional) - The x-coordinate of the ellipse's center. The default is0cm.y(measureValue, optional) - The y-coordinate of the ellipse's center. The default is0cm.rx(measureValue, optional) - The horizontal radius (half the width) of the ellipse. The default is0cm.ry(measureValue, optional) - The vertical radius (half the height) of the ellipse. The default is0cm.x1(measureValue, optional) - The x-coordinate of the first line originating in the ellipse's center. The default is0cm.y1(measureValue, optional) - The y-coordinate of the first line originating in the ellipse's center. The default is0cm.x2(measureValue, optional) - The x-coordinate of the second line originating in the ellipse's center. The default is0cm.y2(measureValue, optional) - The y-coordinate of the second line originating in the ellipse's center. The default is0cm.
Details
The style of this command is defined by the PEN command for the outline and the FILL command to fill the shape.
Pies are based on ellipse's, in which (semi-straight) lines originating in the ellipse's center (x, y) define a sector. The first line takes its course through point (x1, y1) and the second through point (x2, y2). The pie is drawn counter-clockwise between the intersection of the ellipse with the first line and the intersection of the ellipse with the second line.
The points provided for the semi-straight lines should be located outside of the "virtual" ellipse. Otherwise the results can have minor graphical errors.
Rotation is only partially performed. This has an influence on the drawing of relations where the ellipse that the pie is based on will always ignore any kind of rotation and will be drawn as if the relation was going horizontal from the left to the right. The points for the two lines are however rotated. If a rotation is necessary then use a COMPOUND with a CURVE instead.
This command differs from ARC in that it connects the center of the ellipse with the ends of the outline based on the two lines. This creates a closed shape that can be filled with a color.
See Also
Examples
Draw a "bisque" colored pie in the bottom half of an ellipse.
GRAPHREP
SHADOW off

FILL color:"bisque"
PIE x:0cm y:0cm rx:1.5cm ry:1cm
    x1:-2cm y1:2cm x2:2cm y2:0cm
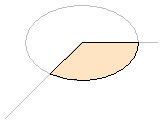
Draw a "bisque" colored pie in the bottom half of an ellipse and visualize the "virtual" ellipse and semi-straight lines.
GRAPHREP
SHADOW off

# Draw the "virtual" ellipse and lines used for the ARC.
PEN color:"gray"
ELLIPSE x:0cm y:0cm rx:1.5cm ry:1cm
LINE x2:-2cm y2:2cm
LINE x2:2cm y2:0cm

# Draw the ARC.
PEN
FILL color:"bisque"
PIE x:0cm y:0cm rx:1.5cm ry:1cm
    x1:-2cm y1:2cm x2:2cm y2:0cm
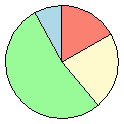
A pie chart with four segments using different colors where the segments are calculated relative to one another. 
GRAPHREP
SHADOW off

# Sum must be 1.
SET aSegmentSizes:({0.17, 0.22, 0.53, 0.08})
SET aSegmentColors:({"salmon", "lemonchiffon", "palegreen", "lightblue"})
SET mRadius:(1.5cm)
# Constants for pi*2 and pi/2 used directly.

SET mX2:(0cm) mY2:(-2cm)
SET rSegmentSum:(0.0)
# Calculate and draw the segments.
FOR nIndex from:(0) to:((LEN aSegmentSizes) - 1) {
  SET rSegmentSum:(rSegmentSum + aSegmentSizes[nIndex])
  # We subtract pi/2 to rotate it by 90° counter-clockwise to fit with the starting coordinates of (0cm, -2cm).
  SET mX1:(mRadius * cos((6.2831853072 * rSegmentSum) - 1.5707963268)) mY1:(mRadius * sin((6.2831853072 * rSegmentSum) - 1.5707963268))
  # Using modulo operator in to rotate through colors in case there are more segments than colors.
  FILL color:(aSegmentColors[INT (nIndex MOD 4)])
  PIE x:0cm y:0cm rx:(mRadius) ry:(mRadius)
      x1:(mX1) y1:(mY1) x2:(mX2) y2:(mY2)
  SET mX2:(mX1) mY2:(mY1)
}
Versions and Changes
Available since ADOxx 1.3